
Level Factory Program Introduction
The 'Level Factory' program is very useful when you want to compare level schemes or to present them in several columns. And you do not need to worry about the high level density that causes the presentation is difficult to understand. The program will split and adjust the positions of the text labels and the levels for you.
Run the Level Factory code
The program is installed in the nucgam server already (whose Python version is 2.3, very old) , you can copy the file /home/tai/3_programs/level_factory/run_level_factory.py to anywhere you want. If you want to install this program in other server at FSU or in your personal laptop, please contact me.
To run the code, you need to use a text editor to edit the 'control panel' section in the run_level_factory.py script, and you only need to set up some easy parameters in the control panel.
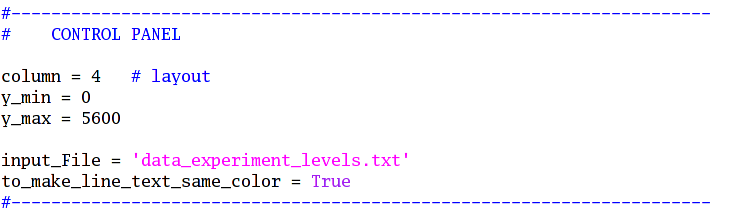
Figure: the control panel.
column = how many columns you want (1 to 4).
y_min = the min y coordinate in the graph.
y_max = the max y coordinate in the graph.
input_File = the data file ( can be any pure text file).
Then key in ./run_level_factory.py or
python run_level_factory.py, you will get a pretty graph from Xmgrace.
And of course, you can fine tune it.
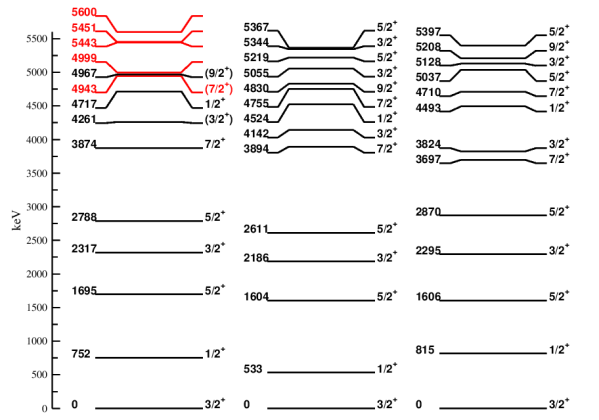
Figure: a sample of the result.
The input file format
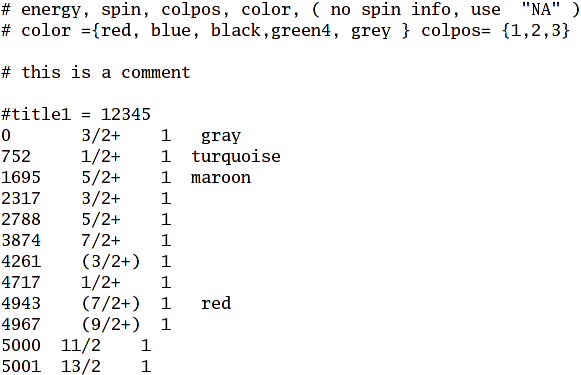
Figure: a sample of the input file.
The rule of data format:
'energy' need to be an integer, no decimal point.
If 'spin' is unknown you have to type it NA . 1/2+ or (1/2)+ or (1/2+) are all allowed.
'energy' and 'spin' information is necessary to run the code.
column position is only 1,2,3,or 4. You can skip it, by default it is the column 1
for color, there are 15 options, such as red, blue, green, green4, yellow,...you can check the Xmgrace. You can skip it, by default it is black.
#title1 = XYZ, you can put the title for a specific column as well.
And any line start with '#' will be considered as a comment.
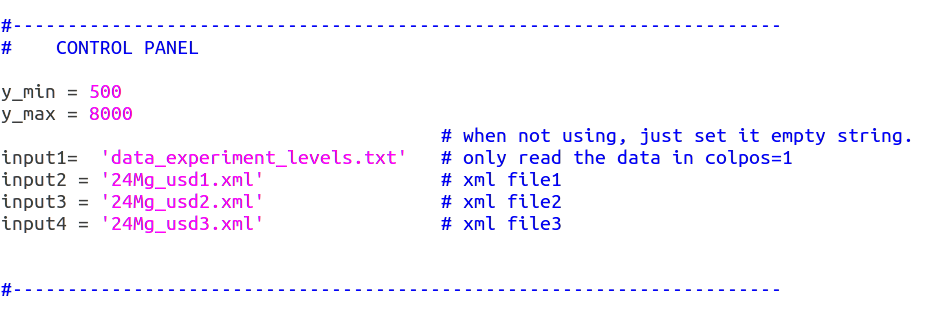
run_comso_level.py
It is a sub branch of the level factory program. It can directly take xxx.xml as your input from shell model calculation ( Dr. Volya's code). You only need to change the control panel. It can take one experiment data set, and up to three xml files. In this code, experiment data is alway at the column 1, and the total number of columns depends on your number of xml files.
Additional Information
The output is .test.agr and you should save as a new file.
Contact: