
Spec Creator Program Introduction
The 'Spec Creator' program is an utility that helps you to generate a pretty Xmgrace graph from the NSM files (1D histogram spectrum). It allows you to plot the inset graph as well. Note: here is a 'txt_to_NSM' converter program in the same folder. It reads in a text file with two columns: channel and the counts. Then the converter will transform the txt file into the NSM format. Just run ./txt_to_NSM txtfile
The previous process was to open a NSM file by Gnuscope (or other programs), then export to .txt or .dat, and use Xmgrace to plot these files. When there are many spectra to plot, these repeating tasks becomes very time consuming and boring. So for my convenience, I write a Python script to generate the plots on the fly.
Run the Spec Creator code
The script name is run_spec_creator.py, and has been installed in the nucgam server already. It is located at /home/tai/3_programs/spec_creator/ directory. You should copy this script to your personal directory, since the permission setting may not allow you to run this script in my folder. If you want to install this program in your personal laptop, please contact me to get the source code.
First, you need to use a text editor to edit the 'control panel' section in the run_spec_creator.py script. There are two control panels, one is to render in a form of multiple parallel panels and the other one is use to inset. For the most cases, control panel 1 should be good for you.
Panel 1
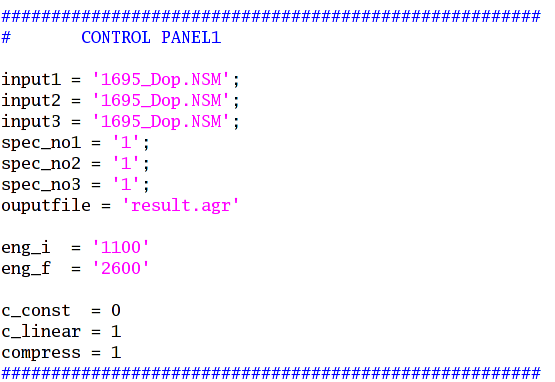
Figure: the control panel 1.
Parameters:
input1 = the NSM1 file path ( ./xxx.NSM or ./NSM/1000.NSM)
input2 = if you do not need it, then set input2=''.
input3 = if you do not need it, then set input3=''.
If your NSM file contain multiple spectra, then you need to specify which one to plot.
spec_no1 = the spectrum no. for input 1
spec_no2 = the spectrum no. for input 2
spec_no3 = the spectrum no. for input 3
eng_i = initial energy (in keV)
eng_f = final energy (in keV)
If you want to compress the spectra, or make linear shifting, then change the following parameters. For example, in gunscope you type in 'k' then -2 2 0, then here in this script, you can set c_const = -2, then c_linear = 2. (Note: E = c_const + c_linear * channel)
c_const = default 0
c_linear = default 1
compress = default 1
To run the script, just key in ./run_spec_creator.py or
python run_spec_creator.py, you will get a pretty graph from Xmgrace.
And of course, you can fine tune it.
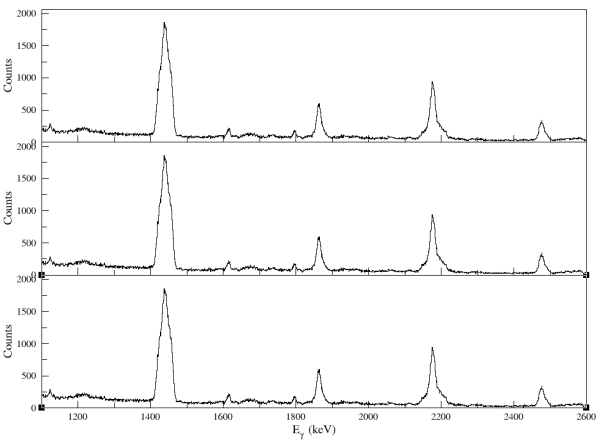
Figure: a sample of the result that using three inputs from the Panel 1. The highest peak will take 90% of the height of the windows.
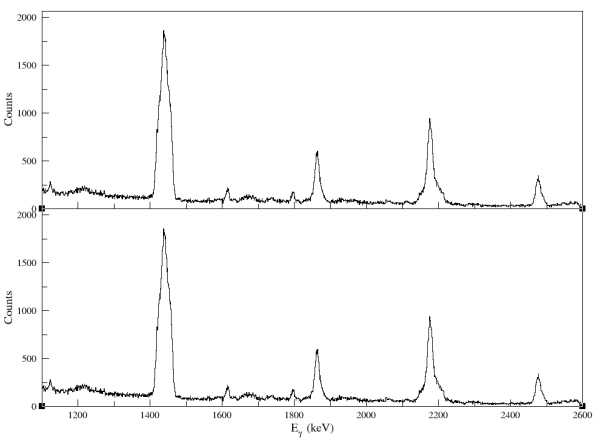
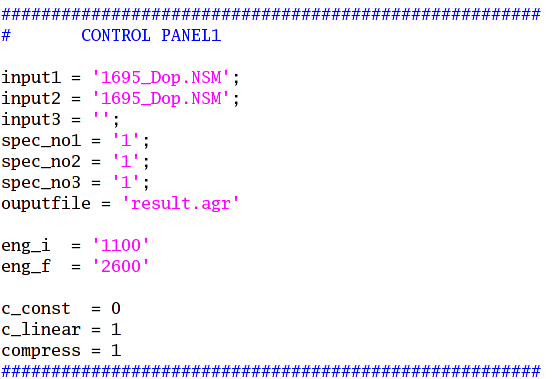
Figure: a sample of the result that using two inputs from the Panel 1.
Panel 2
Panel 2 is for the inset plotting. In Panel 1, you use a single energy range for all the input NSM files. However, in Panel 2 you can set two different energy ranges for 'Normal set' and 'inset'. The process is very similar. First, you have to set use_inset = True in order to activate Panel 2. Then your input1 and input2 from Panel 1 will be your 'Normal' and 'in' set, respectively. Finally, set up the eng_i, eng_f, c_const, c_linear, and compression for them. Then you are ready to run the code.
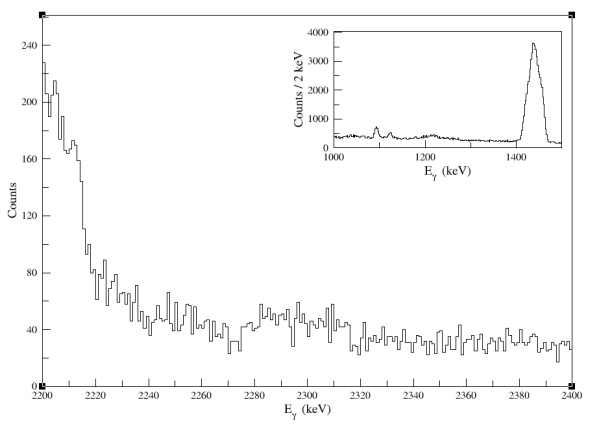
Figure: a sample of the inset result from the Panel 2.
Contact: