
'parseNNDC2' Program Introduction
parseNNDC2 can grab the table from NNDC website
and convert them into a text file for lvl_builder
program to plot the adopted levels and gammas.
( or convert data to SQL data, but I have not
implemented yet)
The table looks like as the following:
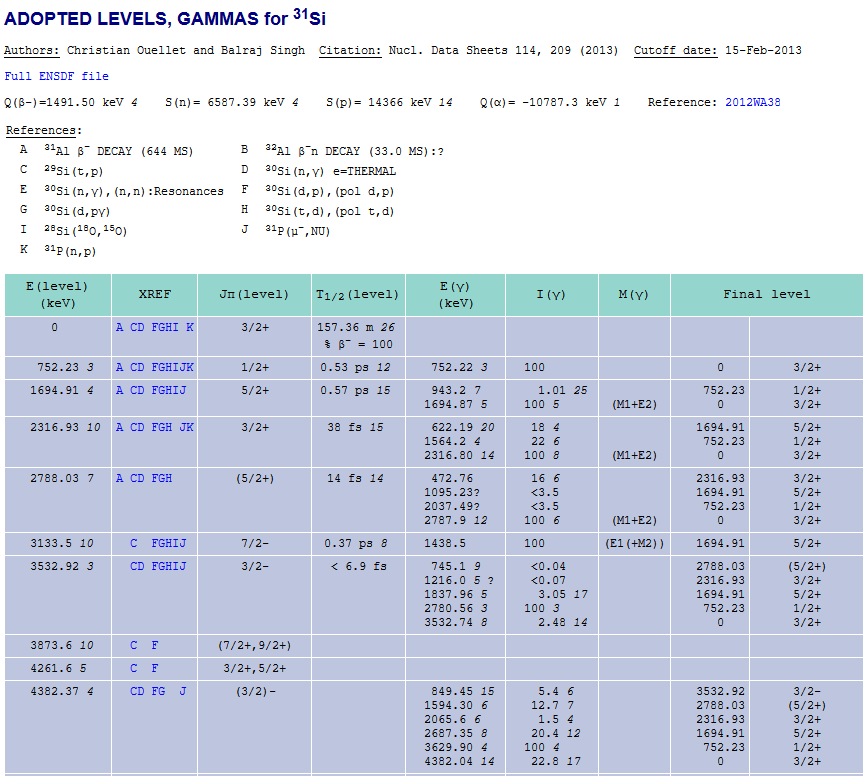
Basically, there are two tables. Ont table for the
references that indicate the types of reactions and
another one is a bigger table; for Excitation energy,
external reference (XERF), spin and parity (JPI),
gamma ray energies, gamma ray intensity...
( note: sometimes the order will change, and sometimes
you could have just the first row but no real data.)
How to use it
parseNNDC2 is a python script, but it needs python3 or higher version to run it.
Just type in python3 ./parseNNDC2.py
Please see my Github (link)
Since parseNNDC2 will use lvl_builder program, and so I put it in the same folder as lvl_builder. You will need to download the entire folder.
parseNNDC2 is menu-driven fashion. The following is the menu when you enter the program.
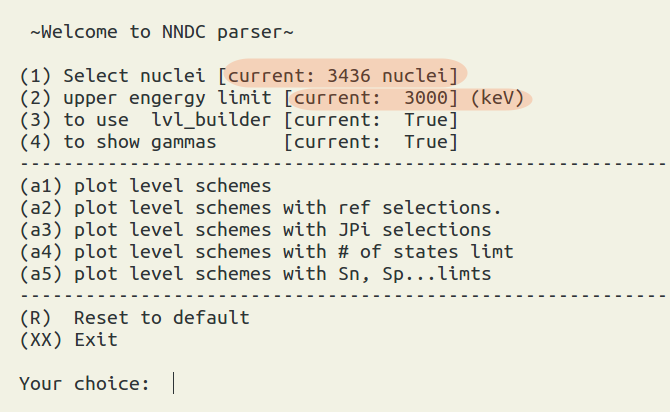
Because we don't set any nuclei yet, and so we should
press "1" to do our selection first. The upper energy
is set to 3000 keV by default, and we will not only plot the levels but also draw the gamma rays by default.
Nuclei selection
Example1:
If you just have a few nuclei want to study, I recommend use "4" to direct input the symbols, such as 31Si.
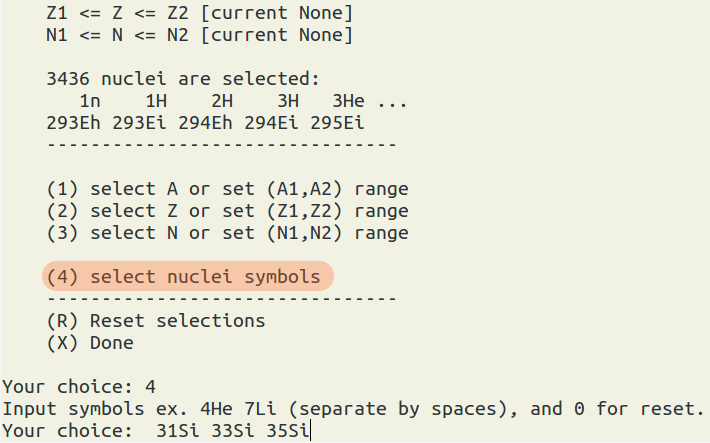
In the above example, we manually input 3 nuclei.
Example2:
If you want to study a series of nuclei, then it is good to select ranges for A, N, or Z.
Let's suppose, we want all nuclei whose A=10-12 and Z=even.
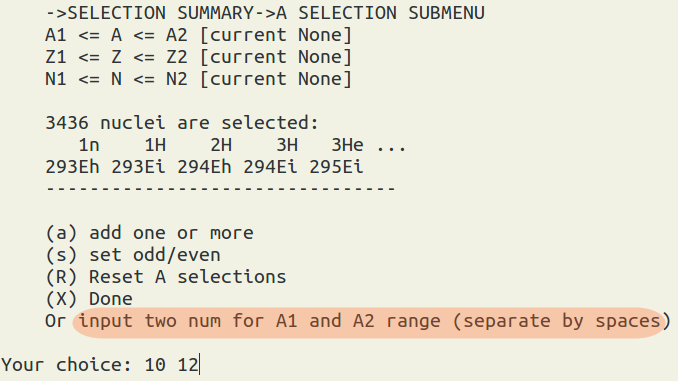
We type "1" to select A or set (A1,A2) range.
then we can immediately input two numbers for A1 and A2 which separating by spaces, ex "10 12"
press "x" for going back to the nuclei selection main menu.
We type "2" to select Z or set (Z1,Z2) range,
and then type "s" to set odd/even nuclei., and then we type "2" for even.
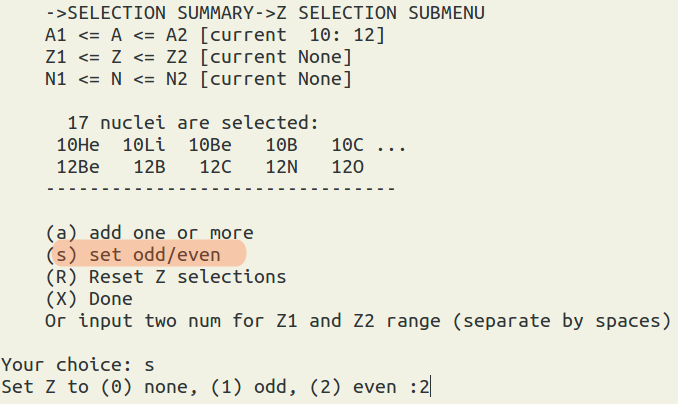
So in the end, we will have 8 nuclei: 10He, 10Be, 10C, 11Be, 11C, 12Be, 12C, 12O.
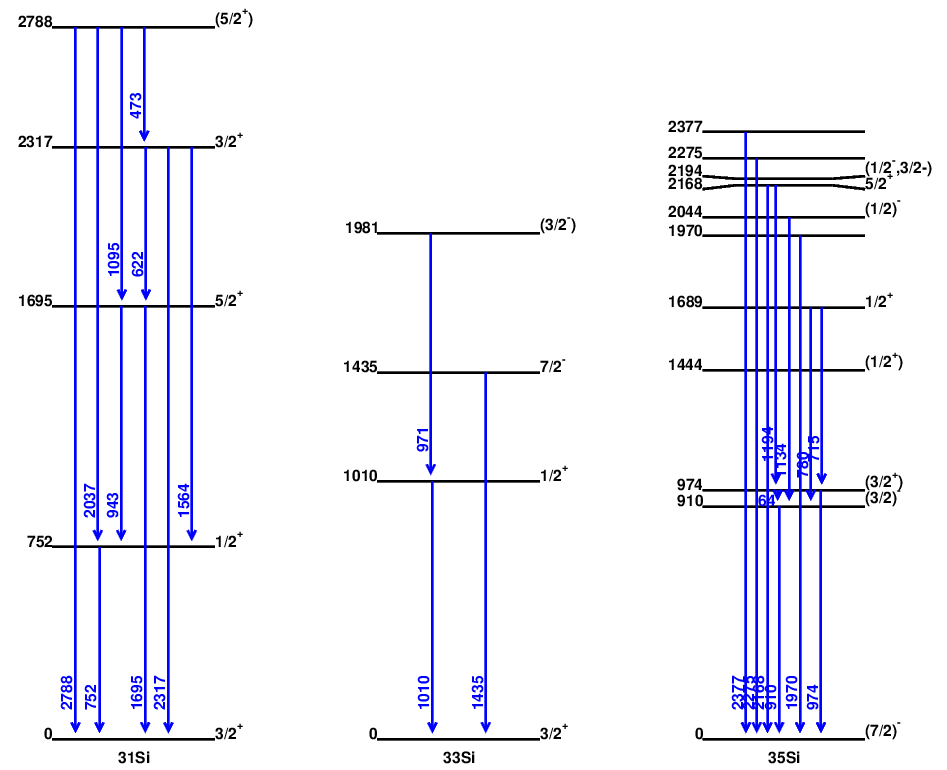
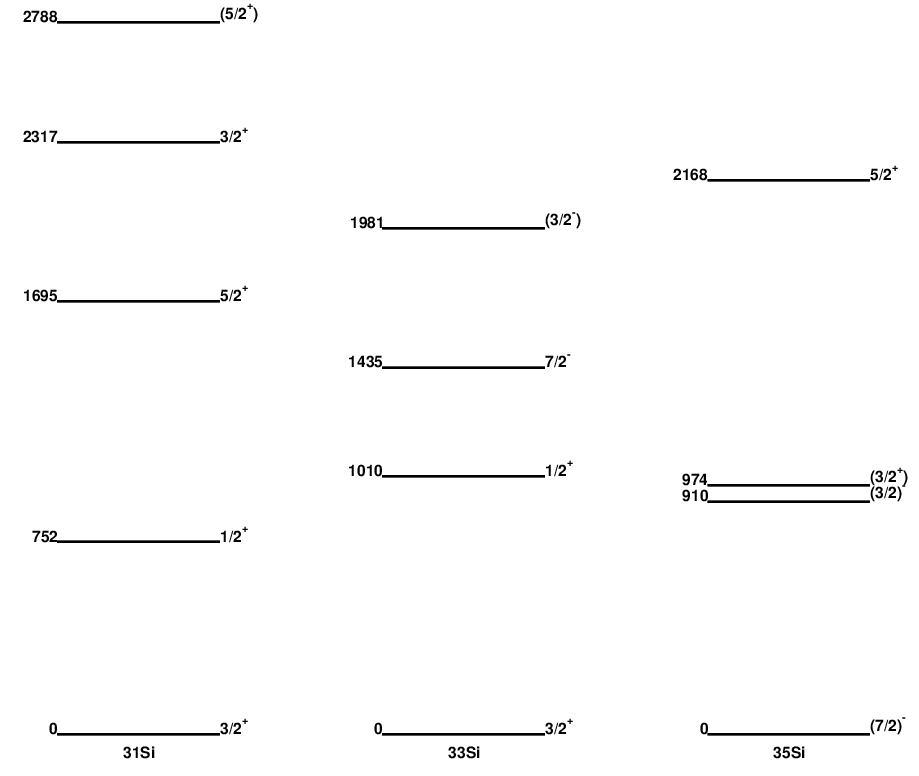
In the following I use 31Si, 33Si, and 35Si as our nuclei selection to do demonstration.
By default, we will generate
- nndc_result.txt -- the plot instruction for lvl_builder program.
- output.agr -- xmgrace file
- output.ps
- bandText_file.txt -- for the text labels.
Note: If you have too many levels, the lvl_builder program will have to spend very long time to calculate the placement. If you find it really takes too long time to plot, I recommend you use ctrl + c to terminate the program. To work around, "nndc_result.txt" is written out before we call lvl_builder program, and so we can use highlighter program to select sub-section of the data to plot.
pre-defined function a1 -- plot level schemes
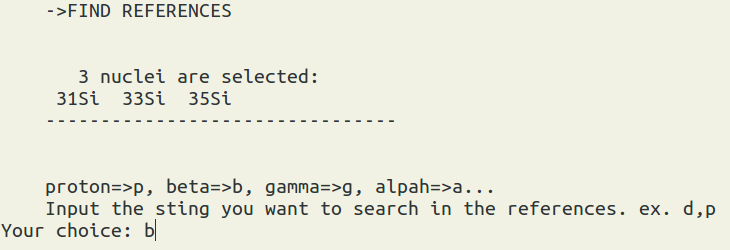
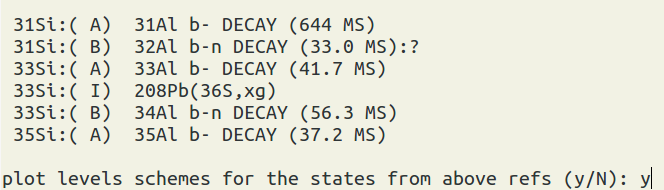
pre-defined function a2 -- plot level schemes with reference selections
Let's suppose we only want to plot the states found by the beta decay experiments:
So we type in "b" for "beta"
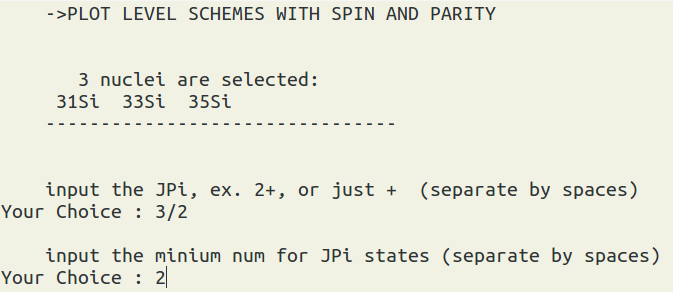
pre-defined function a3 -- plot level schemes with Jpi selections
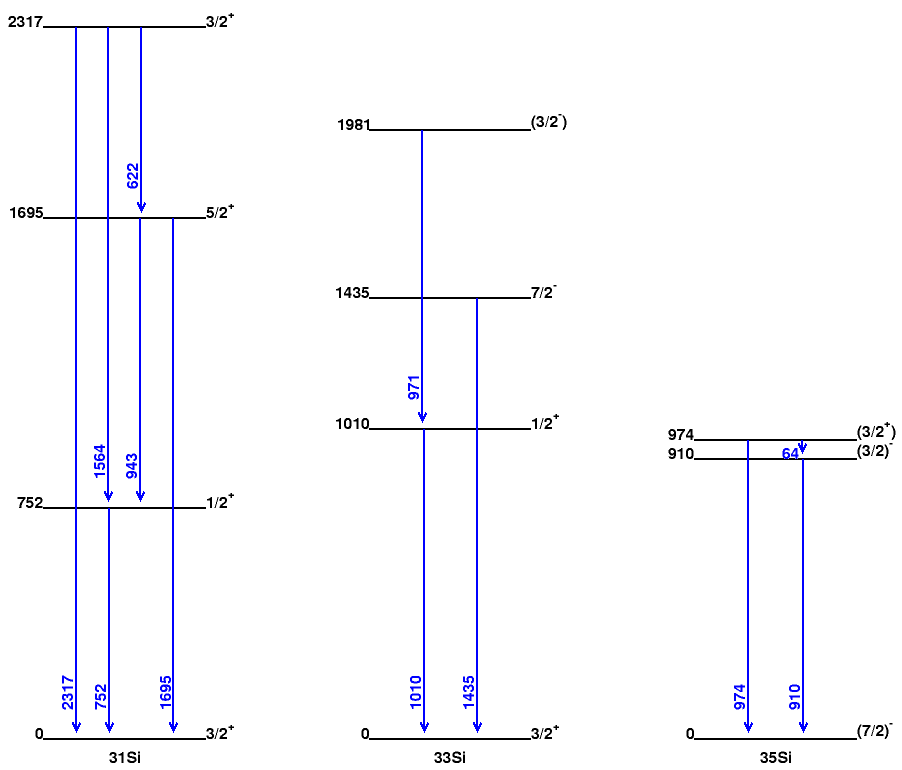
Let's suppose we plot levels for only up to the second J = 3/2 state ( no parity specification).
If we request to plot the gammas, then in order to preserve the final states,
the states whose spins are not 3/2 will still be shown.
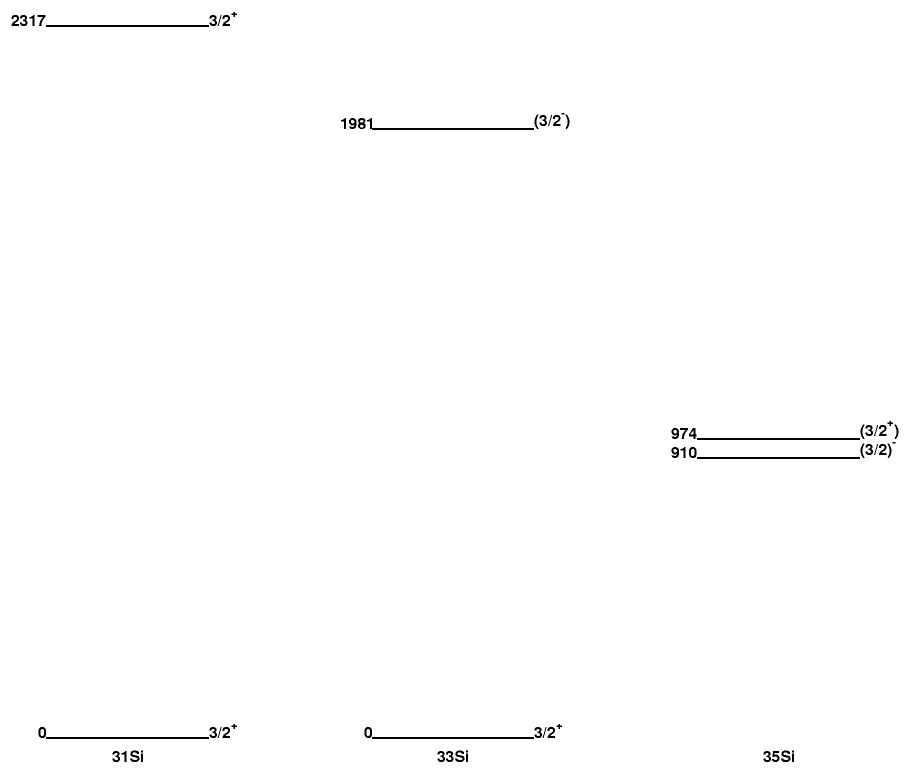
The follow is the same setting but we don't request to plot the gammas,
and so only the states with 3/2 will be displayed.
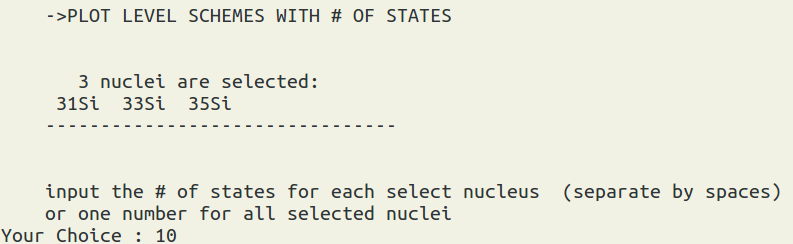
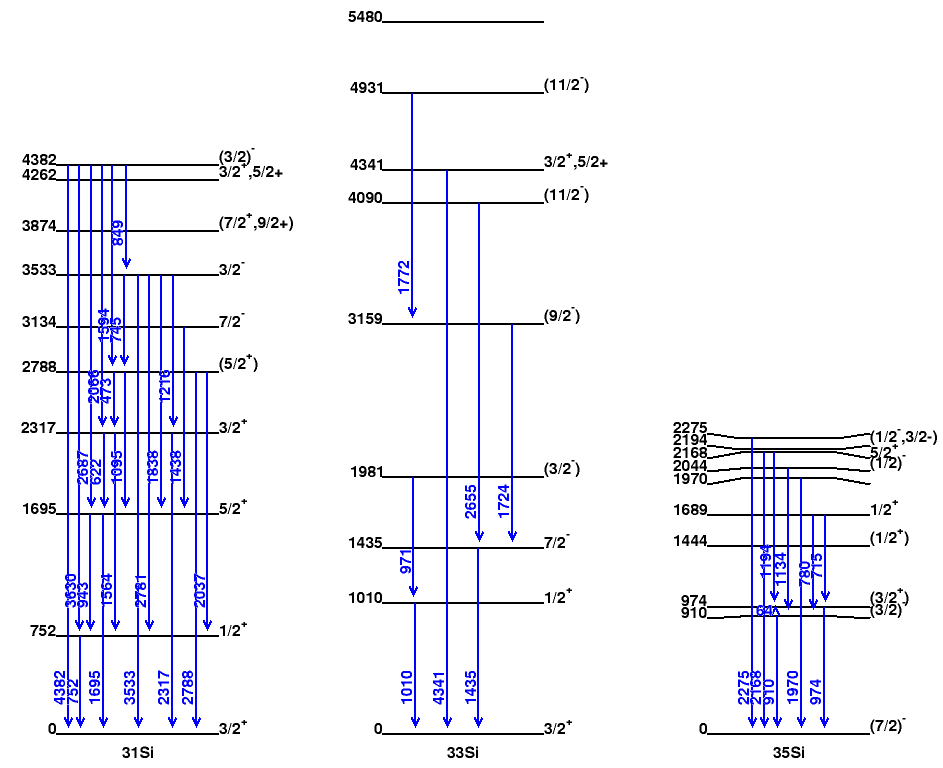
pre-defined function a4 -- plot level schemes with # of states limt
Suppose we only want to plot the lowest 10 states for all 3 nuclei.
We can input "10 10 10" or just "10".
The upper energy limit setting will be ignored.
You can see that we set the limit at 3000 keV, but there are levels above 3000 keV.
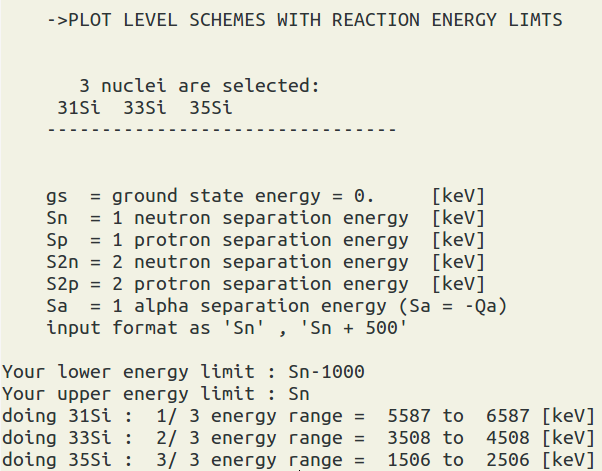
pre-defined function a5 -- plot level schemes with Sn, Sp ... limts
Suppose we only want to plot the states between neutron separation energy (Sn) and Sn-1000 keV.
We can input "Sn-1000" and "Sn". The case is sensitive, and the values are read from the mass16 tables. (https://www-nds.iaea.org/amdc/)
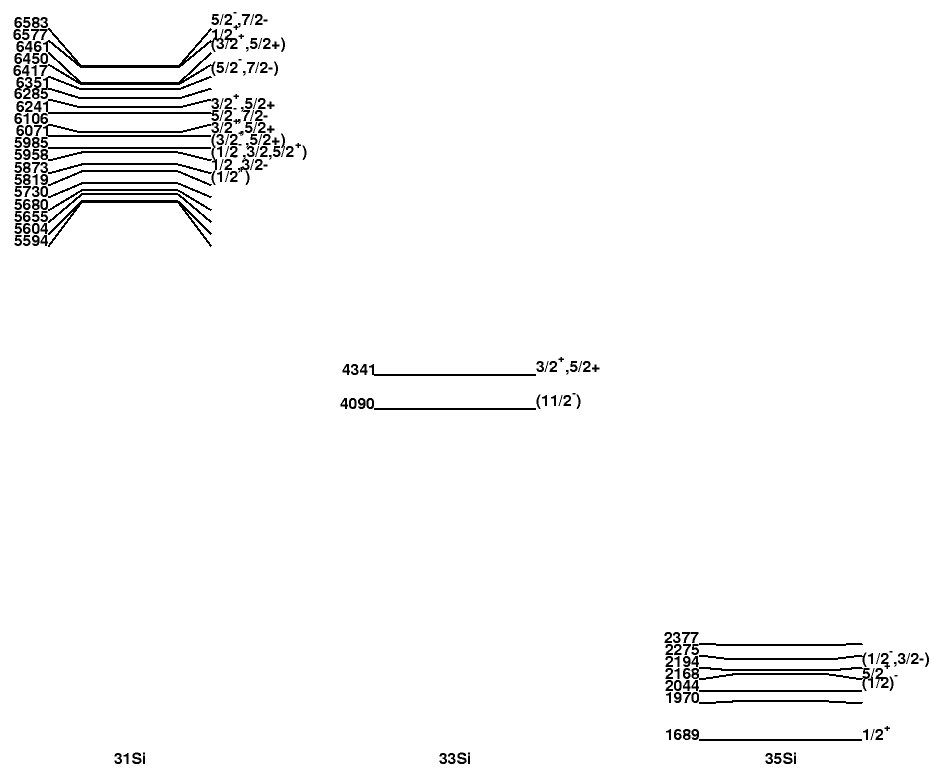
By default we don't plot gammas, since we may miss some final states in these energy ranges. If you find some figures are empty, it could indicate that there is no experimental data yet in your specified energy ranges.
Contact: